


Power BI is a unified, scalable platform for self-service and enterprise business intelligence (BI). Any data can be connected to and visualised, and the visuals may be effortlessly included in the programs that are used every day.
Power BI is the single most significant development in the data analytics industry. Several factors make it crucial, including:
- Microsoft’s Power BI product is a strategic goal for the business.
- It is based on the foundation of Microsoft Excel and SQL Server Analysis Services (SSAS), two of the most established and top BI tools on the market. Many businesses use SSAS, Microsoft’s enterprise-grade reporting tool, for their extensive business intelligence reporting initiatives.
- Despite having roots in SSAS and Excel, Power BI is currently being created or rebuilt using cutting-edge technologies like HTML 5.0, cloud computing, column-store databases, and contemporary mobile apps for smartphones.
- In order to decide what it will develop and deliver next, Microsoft is actively listening to the community.
There are three Power BI-branded products.
Power BI Service:
This is the cloud solution that makes sharing live business analytics a snap. Need to share a 250MB report? No problem! Small or large reports and dashboards can be shared both internally within the company and externally with other parties. A brand-new front end for rendering was created specifically for the Power BI Service. The service can store your data online, and/or connect to your data in the cloud via Azure, and/or connect to your in-house data via a Power BI Gateway.
Power BI Desktop:
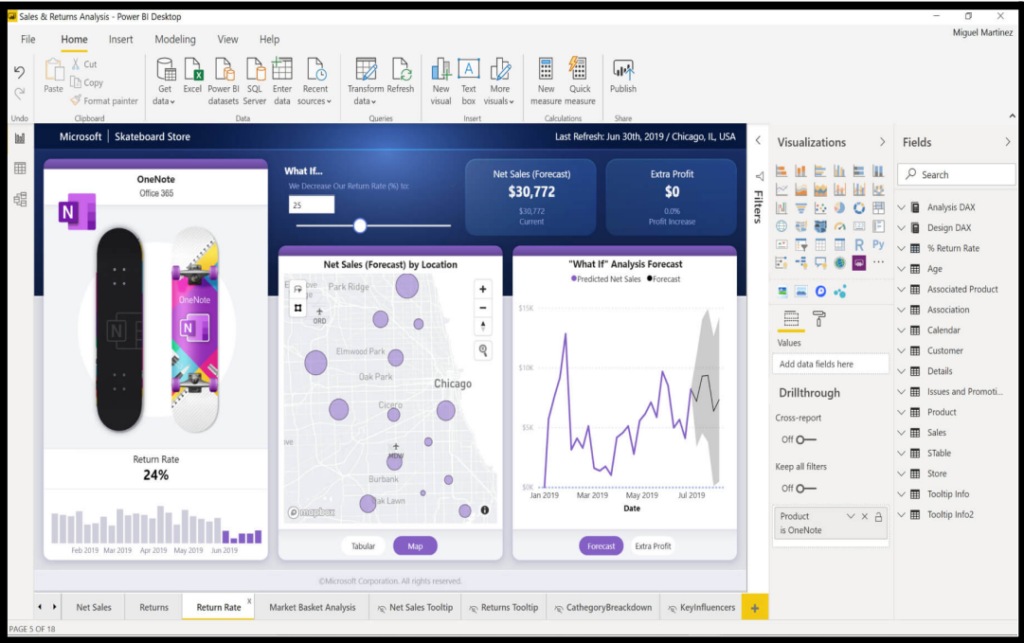
This is the free Power BI authoring tool that enables you to analyse the data swiftly and easily and discover insights on your PC. The general procedure is to link to your data, reshape it as necessary, load it into the data model, enhance it to reveal data insights, and then create
eye-catching visuals to aid in business analysis. The workbook can then be saved (just like in Excel), shared for free with others (via email or network drive), or—even better—published immediately to the Power BI Service with just a few clicks. Once the analysis has been uploaded to the Power BI Service, sharing it with others is simple.
Power BI Mobile:
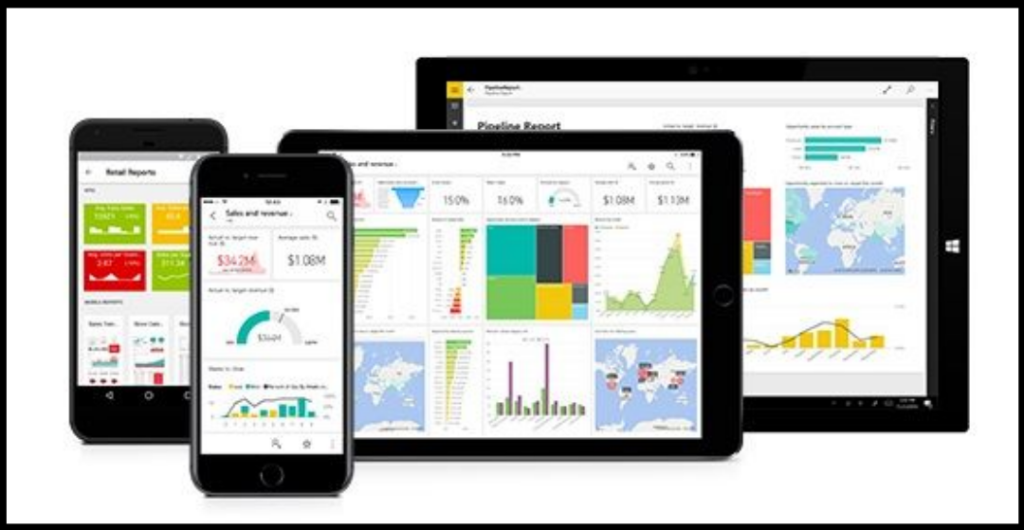
The Power BI Service provides a free mobile tool that enables one to access any of the reports that are made available. For every tablet and smartphone, there are variations. It enables one to manage their business directly from a mobile device
Access data in the cloud or on-premises SQL Server storage. Keep track of KPIs and reports on the move with the help of Power BI Mobile apps, which provide you with a complete picture of your data. Also, use mobile devices and application control tools to keep company data secure. Receive push notifications for alerts about your personal data, and on iOS, use 3D touch to rapidly access shortcuts from the home screen. See your data update in real time on phones, tablets, and Apple Watch
Power BI Umbrella Products
The Power BI branded products are supported by a number of underlying “products” and technologies. These broad categories of products are the enabling technologies that underpin Microsoft’s Self Service BI Strategy (and also Enterprise BI in some cases).
Power BI Data Modelling:
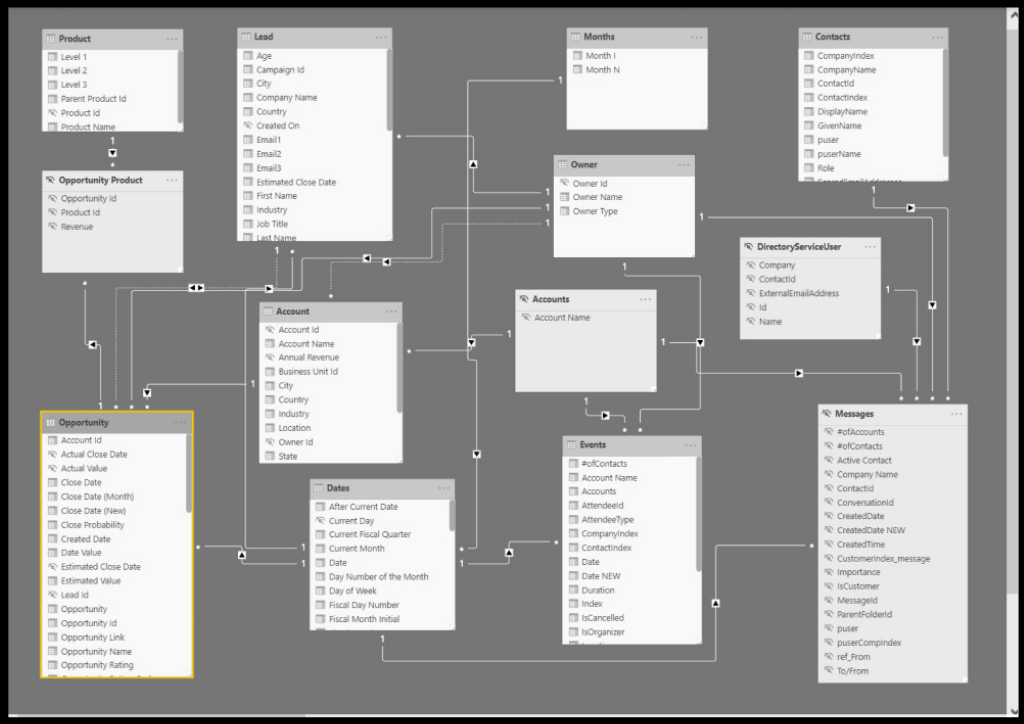
Data modelling is one of the features used in BI tools to establish relationships between various data sources. When using several data sources, you can create interesting data visualisations by defining the relationships between them. This enables companies to create new measures and perform unique
calculations with the help of the Power BI data modelling language, DAX (Data Analysis Expressions) that transform your raw data into insightful business knowledge
Power Query:
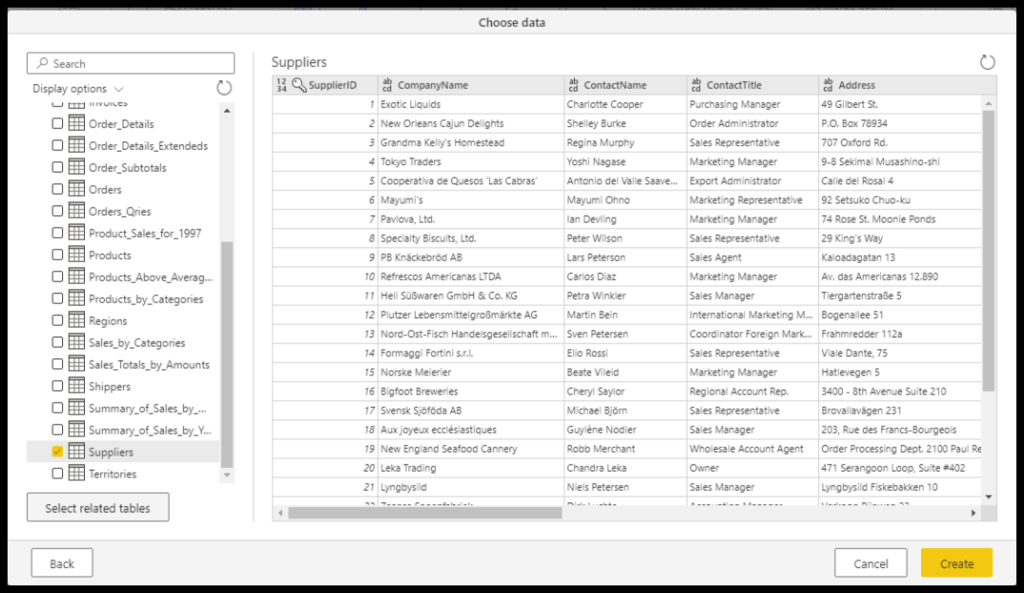
Power Query is a tool for gathering and transforming data. It enables business users to collect data from anywhere and then clean, restructure, and prepare the data for analytics. Although Power Query is a user interface-driven tool, which makes it simple for anyone to
handle and load data, it is underpinned by a strong programming language called “M,” which gives it a ton of power. You can write your own defining codes with this tool as well
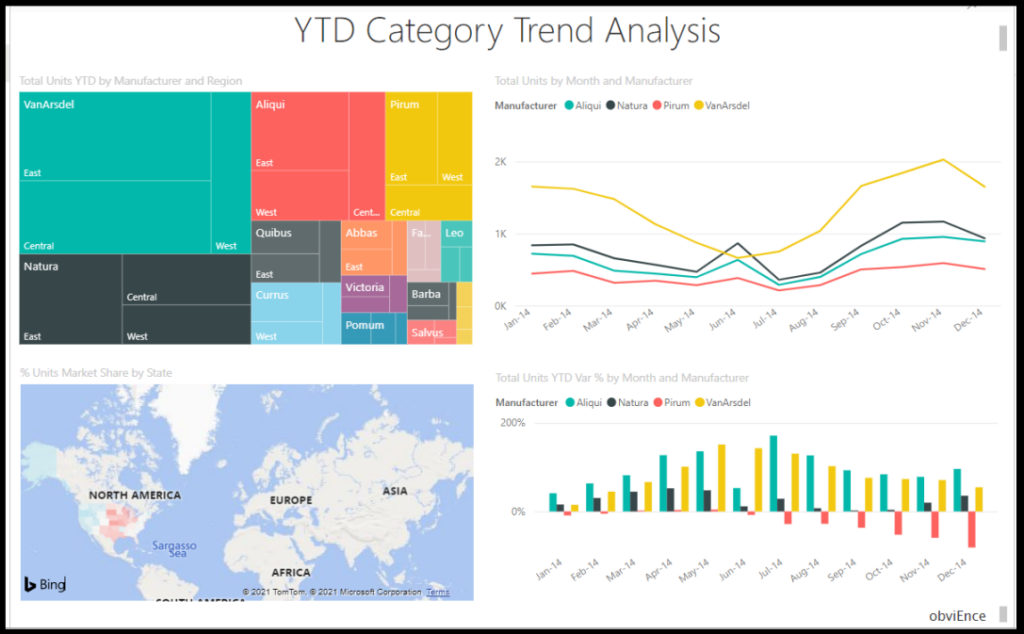
Power BI Reports:
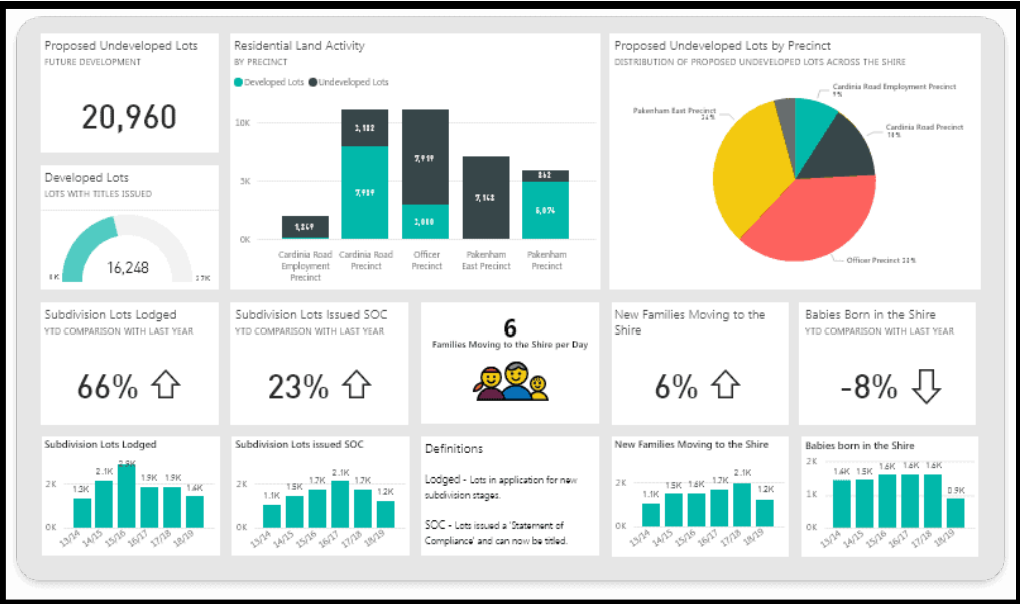
Power BI offers many different types of visuals to show the data insights in reports. Moreover, Power BI supports a number of integrations, including esri, R, Python, and others, as well as bespoke visualisations. The end-user can successfully understand
the data thanks to Power
BI’s numerous formatting options for the reports. Power BI Desktop allows users to prepare reports for sharing in a variety of ways. Also, utilising the report elements in Power BI, dashboards may be easily created.
Power BI – Architecture:
Power BI includes the following components:
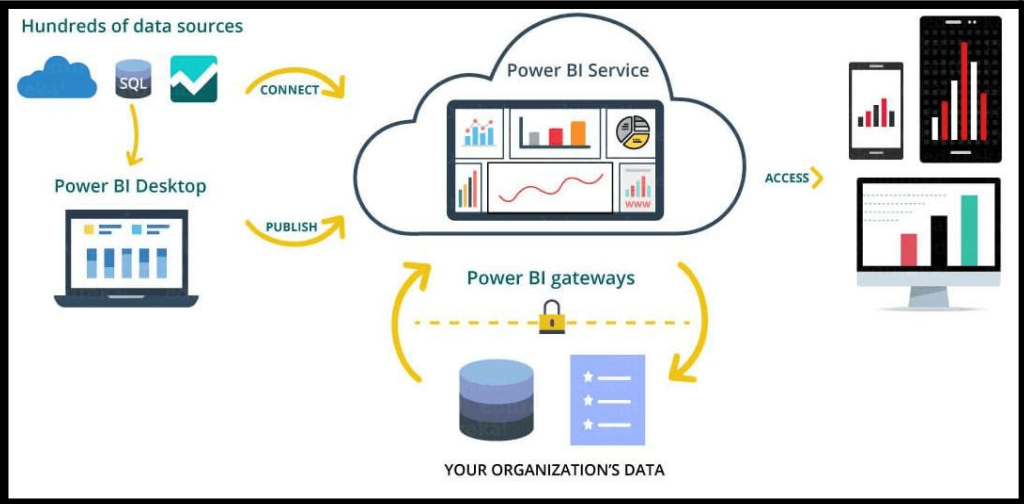
- Power BI Desktop: This is used to create reports and data visualisations on the dataset.
- Power BI Gateway: You can use the Power BI on-premises gateway to keep your data up-to-date by connecting to on-premises data sources without the need to move the data. It allows you to query large datasets and benefit from the existing investments.
- Power BI Mobile Apps: Using Power BI mobile apps, you can stay connected to their data from anywhere. Power BI apps are available for Windows, iOS, and Android platforms.
- Power BI Service: This is a cloud service and is used to publish Power BI reports and data visualisations.
Benefits of Power BI:
- A single platform for data analytics. The Power BI platform scales easily and combines self-service analytics and enterprise analytics in a single product. This does away with the need for multiple analytics solutions, which saves money and reduces security issues.
- Seamless integration. Power BI naturally integrates seamlessly with Microsoft 365 and Azure and also connects with multiple data sources and third-party solutions.
- AI-driven insights. The Microsoft team is constantly updating Power BI with new AI and ML capabilities through features such as AI-enhanced visuals, interactive reports, and conversational AI.
- Customizable design. Among other proven Power BI capabilities, the customizable design ensures that all dashboards and reports have a cohesive look and structure and integrate with the existing corporate style.
- Flexible report configuration. The BI space is extensive and dynamic, and so is Power BI’s ability to adjust to changing business needs. Power BI allows users to easily reconfigure reports as soon as new requirements appear.
- Secure data. Power BI has multi-level security to keep data protected in the cloud, on-premises, or both.
- Make decisions with confidence. Work together easily on the same data, collaborate on reports, and share insights across popular Microsoft Office applications such as Microsoft Teams and Excel. Empower everyone in your organisation to quickly make data-driven decisions that drive strategic actions.
Conclusion
Data analytics is a growing challenge for companies that want to ride the wave of rapid change with data-driven decision-making and forecasting. With Microsoft Power BI, enterprises can arrange their data in a clear, easy-to-use way. Business owners become empowered to make decisions in hours, not months, and their employees gain easy access to the data they need for tasks and workflow streaming.


One Response
Nice Article